The Pricing Engine: A UX Strategy to Solve Cognitive Overload in B2B Jewelry Design
Replacing Spreadsheets with a Responsive Dashboard to Automate Tariff Calculation and Empower Field Sales.
Company
Jewelry Company
My Role
Solo UX Designer & Researcher
Tools
Figma Builder.io Excel VSC - Claude Code Claude Code-MCP
Timeline
On Going
Challenge
A sudden hike in tariffs threw the company into chaos. Pricing jewelry became a guessing game. The Product, MIS, and Sales teams were working in silos using manual spreadsheets, leading to a 2-week turnaround time for price quotes. Retailers were losing patience, and sales were dropping.
impact
Speed: Quote request timeline dropped from 2 weeks to 2 days (85% reduction).
Sales: Sales reps converted 25% of previously lost quote requests into successful orders.
Efficiency: Inventory turnover rate increased by 30%.

Problem
A sudden hike in global tariffs threw the company into chaos. Pricing jewelry, which requires precise calculation of metal weight and daily market rates, became a guessing game.
The Core Issues:
Operational Silos: The Product, MIS, and Sales teams were working in isolation using disparate manual spreadsheets.
The Bottleneck: For a price change or new product, the MIS team had to wait for the Design team to manually recalculate costs.
The Business Consequence: This led to a 2-week turnaround time for simple price quotes. Retailers were losing patience, sales were dropping, and the Sales team had no data to pacify them.
The Hypothesis: If we replace isolated spreadsheets with a Centralized Pricing Source of Truth that automates calculations based on live data, we can eliminate human error and restore retailer trust.
The Before

The Process
To solve this, we moved through a structured design thinking process, starting with deep research into internal workflows.
Phase A: Research & Discovery
We conducted Journey Mapping and interviews with three key departments to understand the human side of the data failure.
MIS Team: They were forced to "guess" new prices by applying estimated percentages to old data because they lacked a centralized source.
Product Team: They were trapped in a loop of manually coordinating margins with multiple vendors.
Sales Team: They were "in the dark," unable to answer retailer questions about cost, leading to lost orders.
The Insight: The root cause wasn't the tariffs; it was the lack of accurate information.

Phase B: Design & Development Strategy
We broke the solution into three actionable phases:
Digitization: We created a digital tool to standardize vendor data, moving teams away from local spreadsheets.
Integration (The "Brain"): We connected the tool to the ERP system for design data and Kitco.com for live precious metal rates. This allowed the system to calculate: Price = (Live Metal Rate + Vendor Margin + Tariff).
Inventory Management: (Ongoing) Connecting Sales and Purchase orders for a full stock view.
The Insight: Research identified the need for a centralized, cross-platform dashboard... replacing fragmented local spreadsheets with a unified operational backbone for pricing and inventory.
Phase C: Testing & Iteration
During the first round of testing (3 weeks with the Product Team), we faced a major hurdle.
The Challenge: The team struggled to adopt the tool because their Mental Model was wired to the flexibility of Excel.
The Fix: We adjusted the onboarding to emphasize speed and accuracy, bridging the gap between their manual workflow and the new automated flow.
The Insight: Users resist structure when they are used to the freedom of Excel. Successful adoption required demonstrating a clear value exchange: trading "flexibility" for "speed and infallible accuracy."
The Solution
We launched "PriceHub," a centralized digital pricing engine.
Key Features:
The Centralized Dashboard: A single view where the MIS team sees tariff alerts, the Product team inputs vendor margins, and the Sales team sees the final, approved price.
The Pricing Engine: A feature allowing the Product team to instantly compare costs between local vs. overseas vendors to maximize profit margins.
Live Automation: Prices update automatically based on real-time market fluctuations, removing the need for manual recalculation.
After


4. Projected Impact
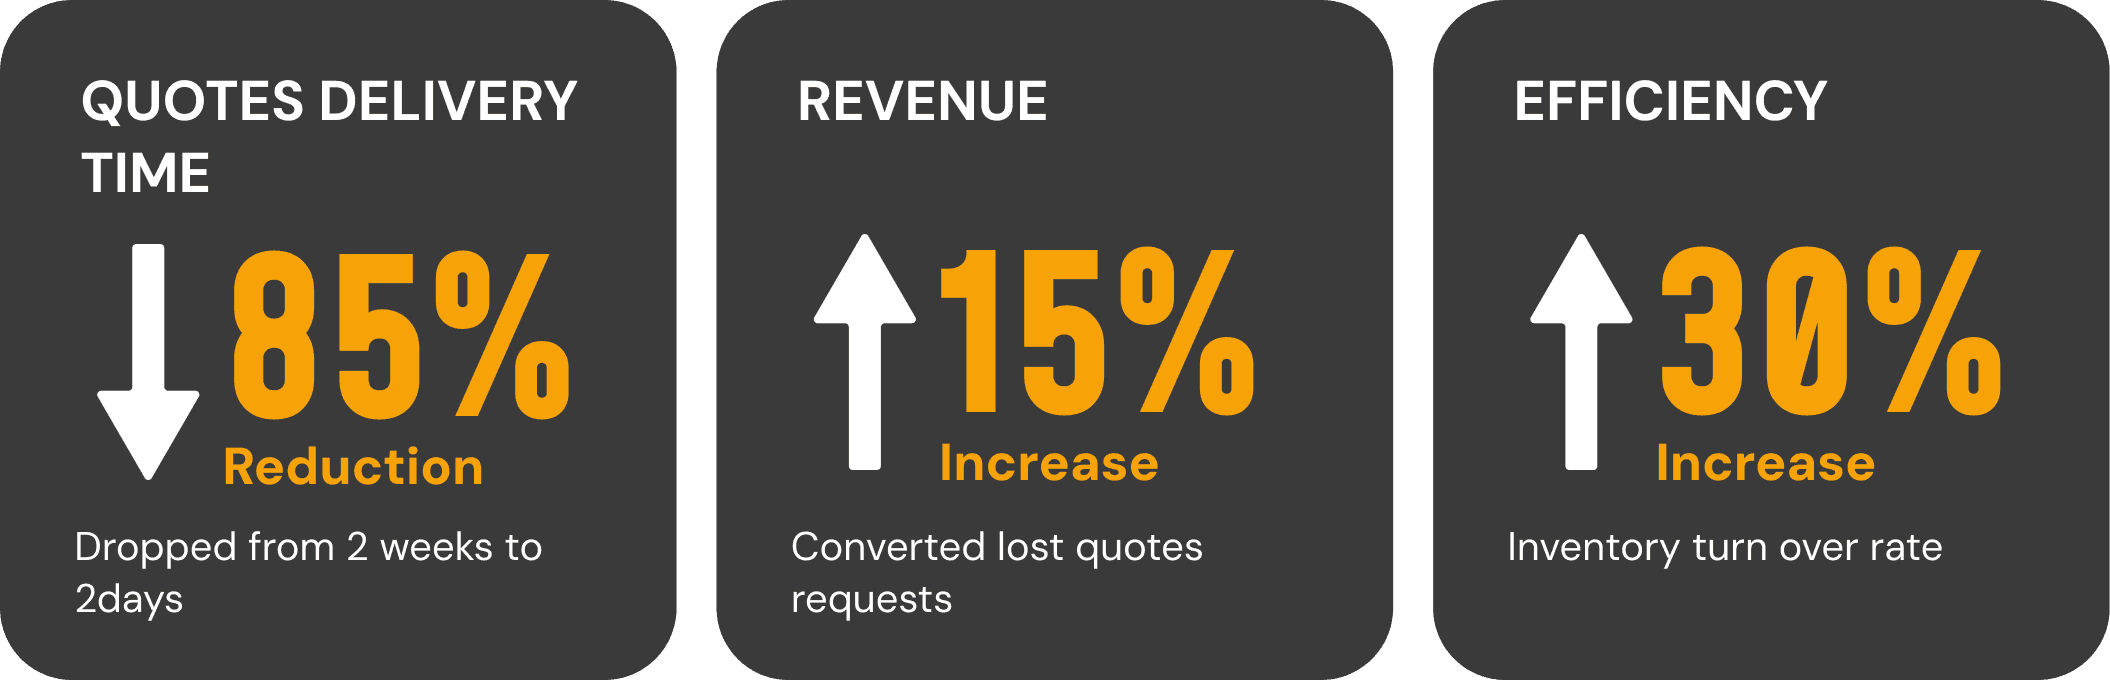
The tool transformed the company's operational efficiency and sales performance.
Speed: Quote request turnaround time dropped from 2 weeks to 2 days (85% reduction).
Revenue: Sales reps converted 25% of previously "lost" quote requests into successful orders because they could provide instant, accurate pricing.
Efficiency: The inventory turnover rate increased by 30%.
5. Key Takeaways
1. In Enterprise UX, Excel is the Competitor The biggest challenge wasn't the UI design, but breaking the habit of using spreadsheets. We won users over by proving the tool was more accurate and less stressful than Excel.
2. Trust is Built on Accuracy Management bought into the tool during testing not because of the interface, but because the pricing data was "down-to-the-cent" accurate compared to their previous estimates.
3. Evolution is Necessary The tool started as a fix for the Design team but evolved into an ecosystem for MIS, Sales, and Inventory. A good internal tool grows with the company's needs.